archive
museum-visualization
A visualization of sensor data collected with a phone during a visit to the The Metropolitan Museum of Art.
Using three.js and WebGL
01
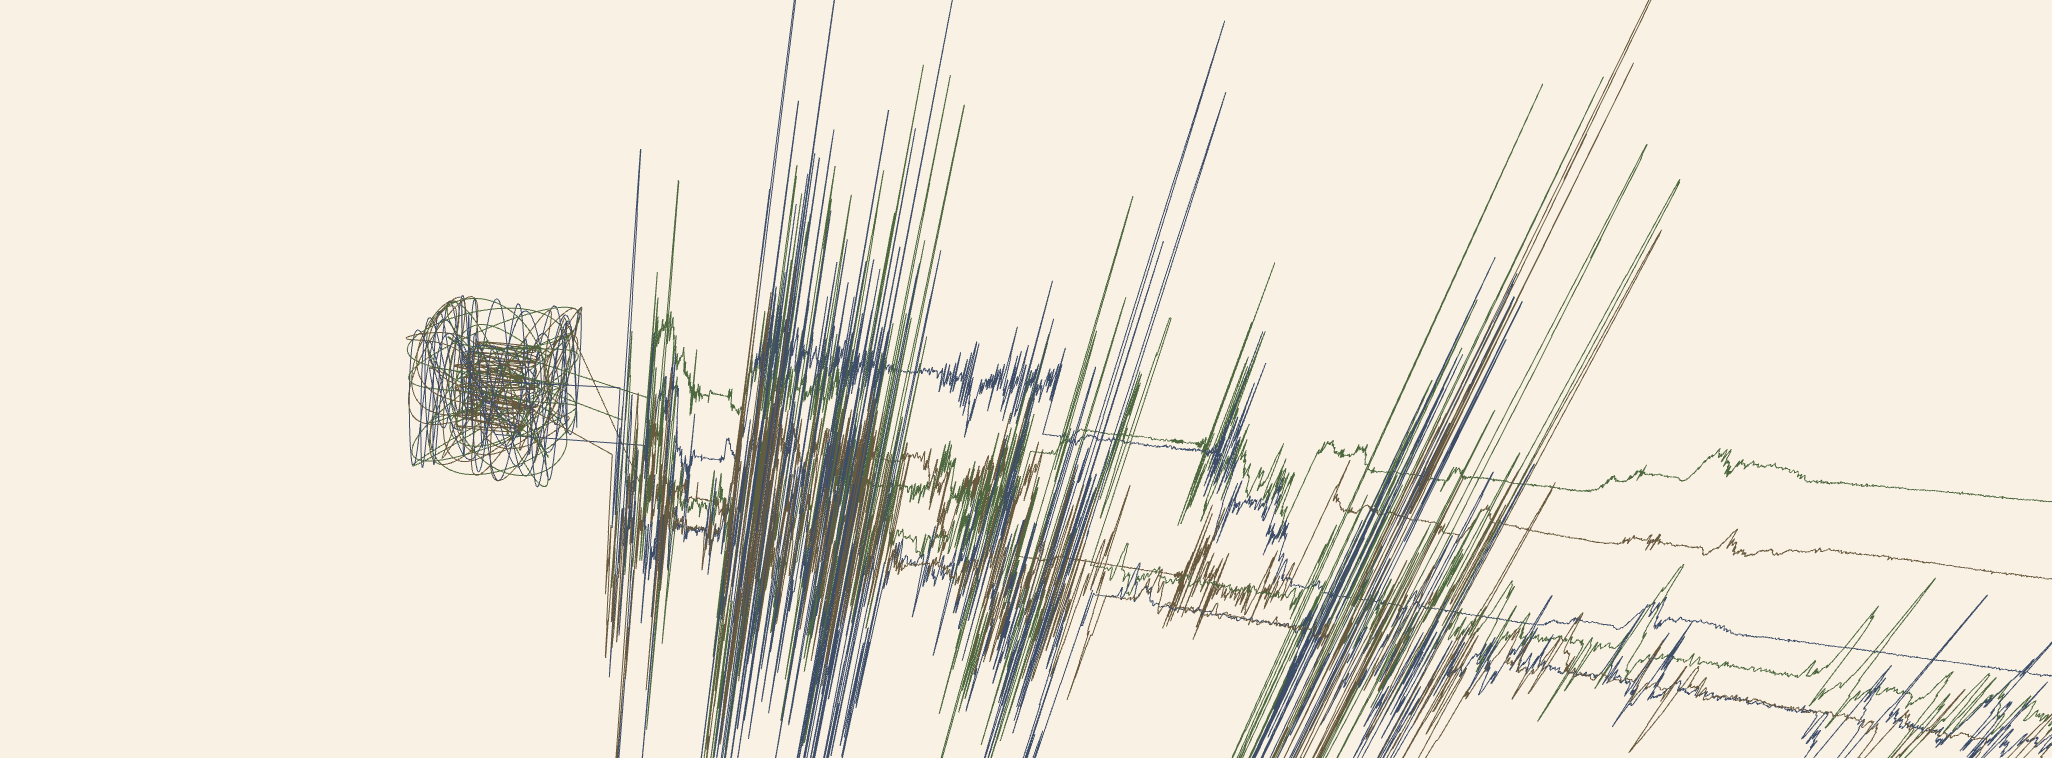
My museum walk represented in accelerometer and gyro readings. The positioning of the coordinates depends on the x, y, and z readings.

02
My museum walk represented in accelerometer and gyro readings. The coordinates are represented in a graph-like style.

03
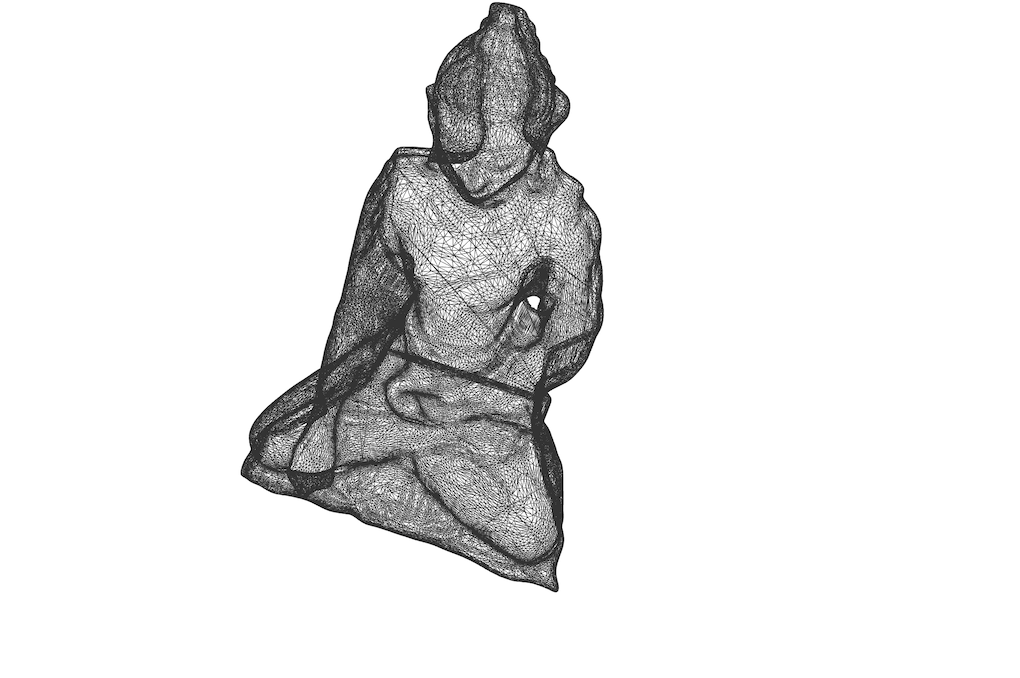
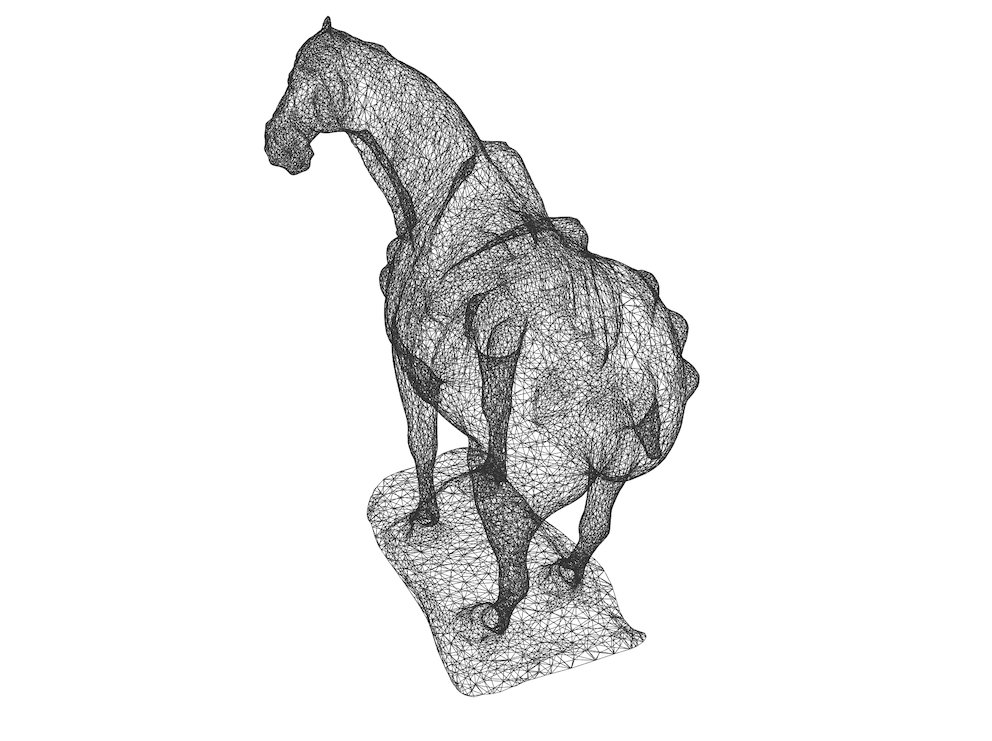
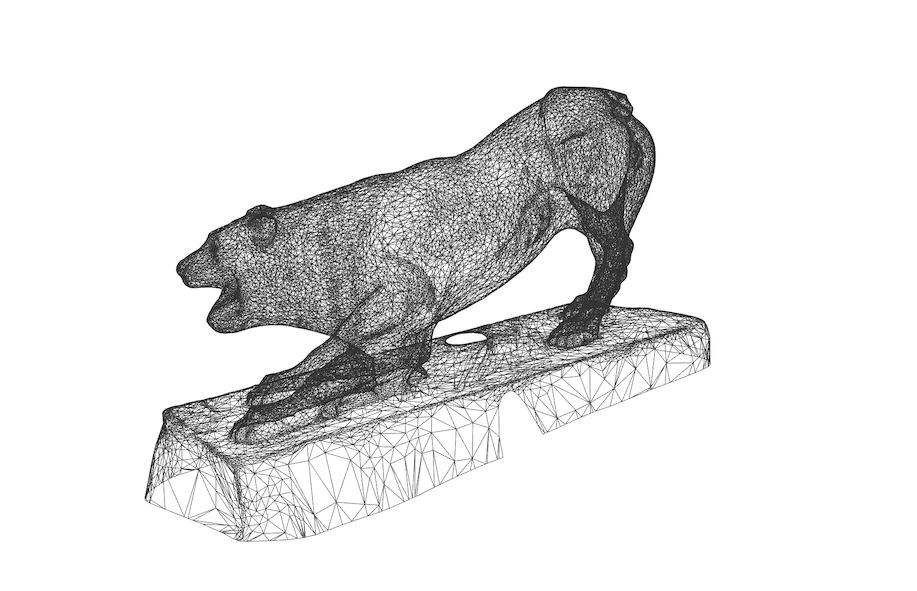
The Data Altar of my museum walks.
04
05
06
07
08
Combined Visualization
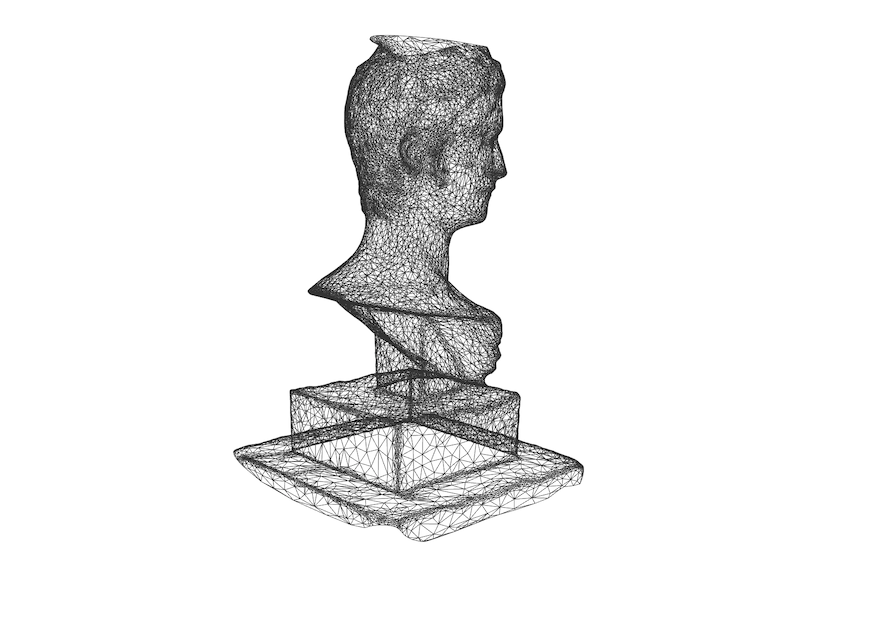
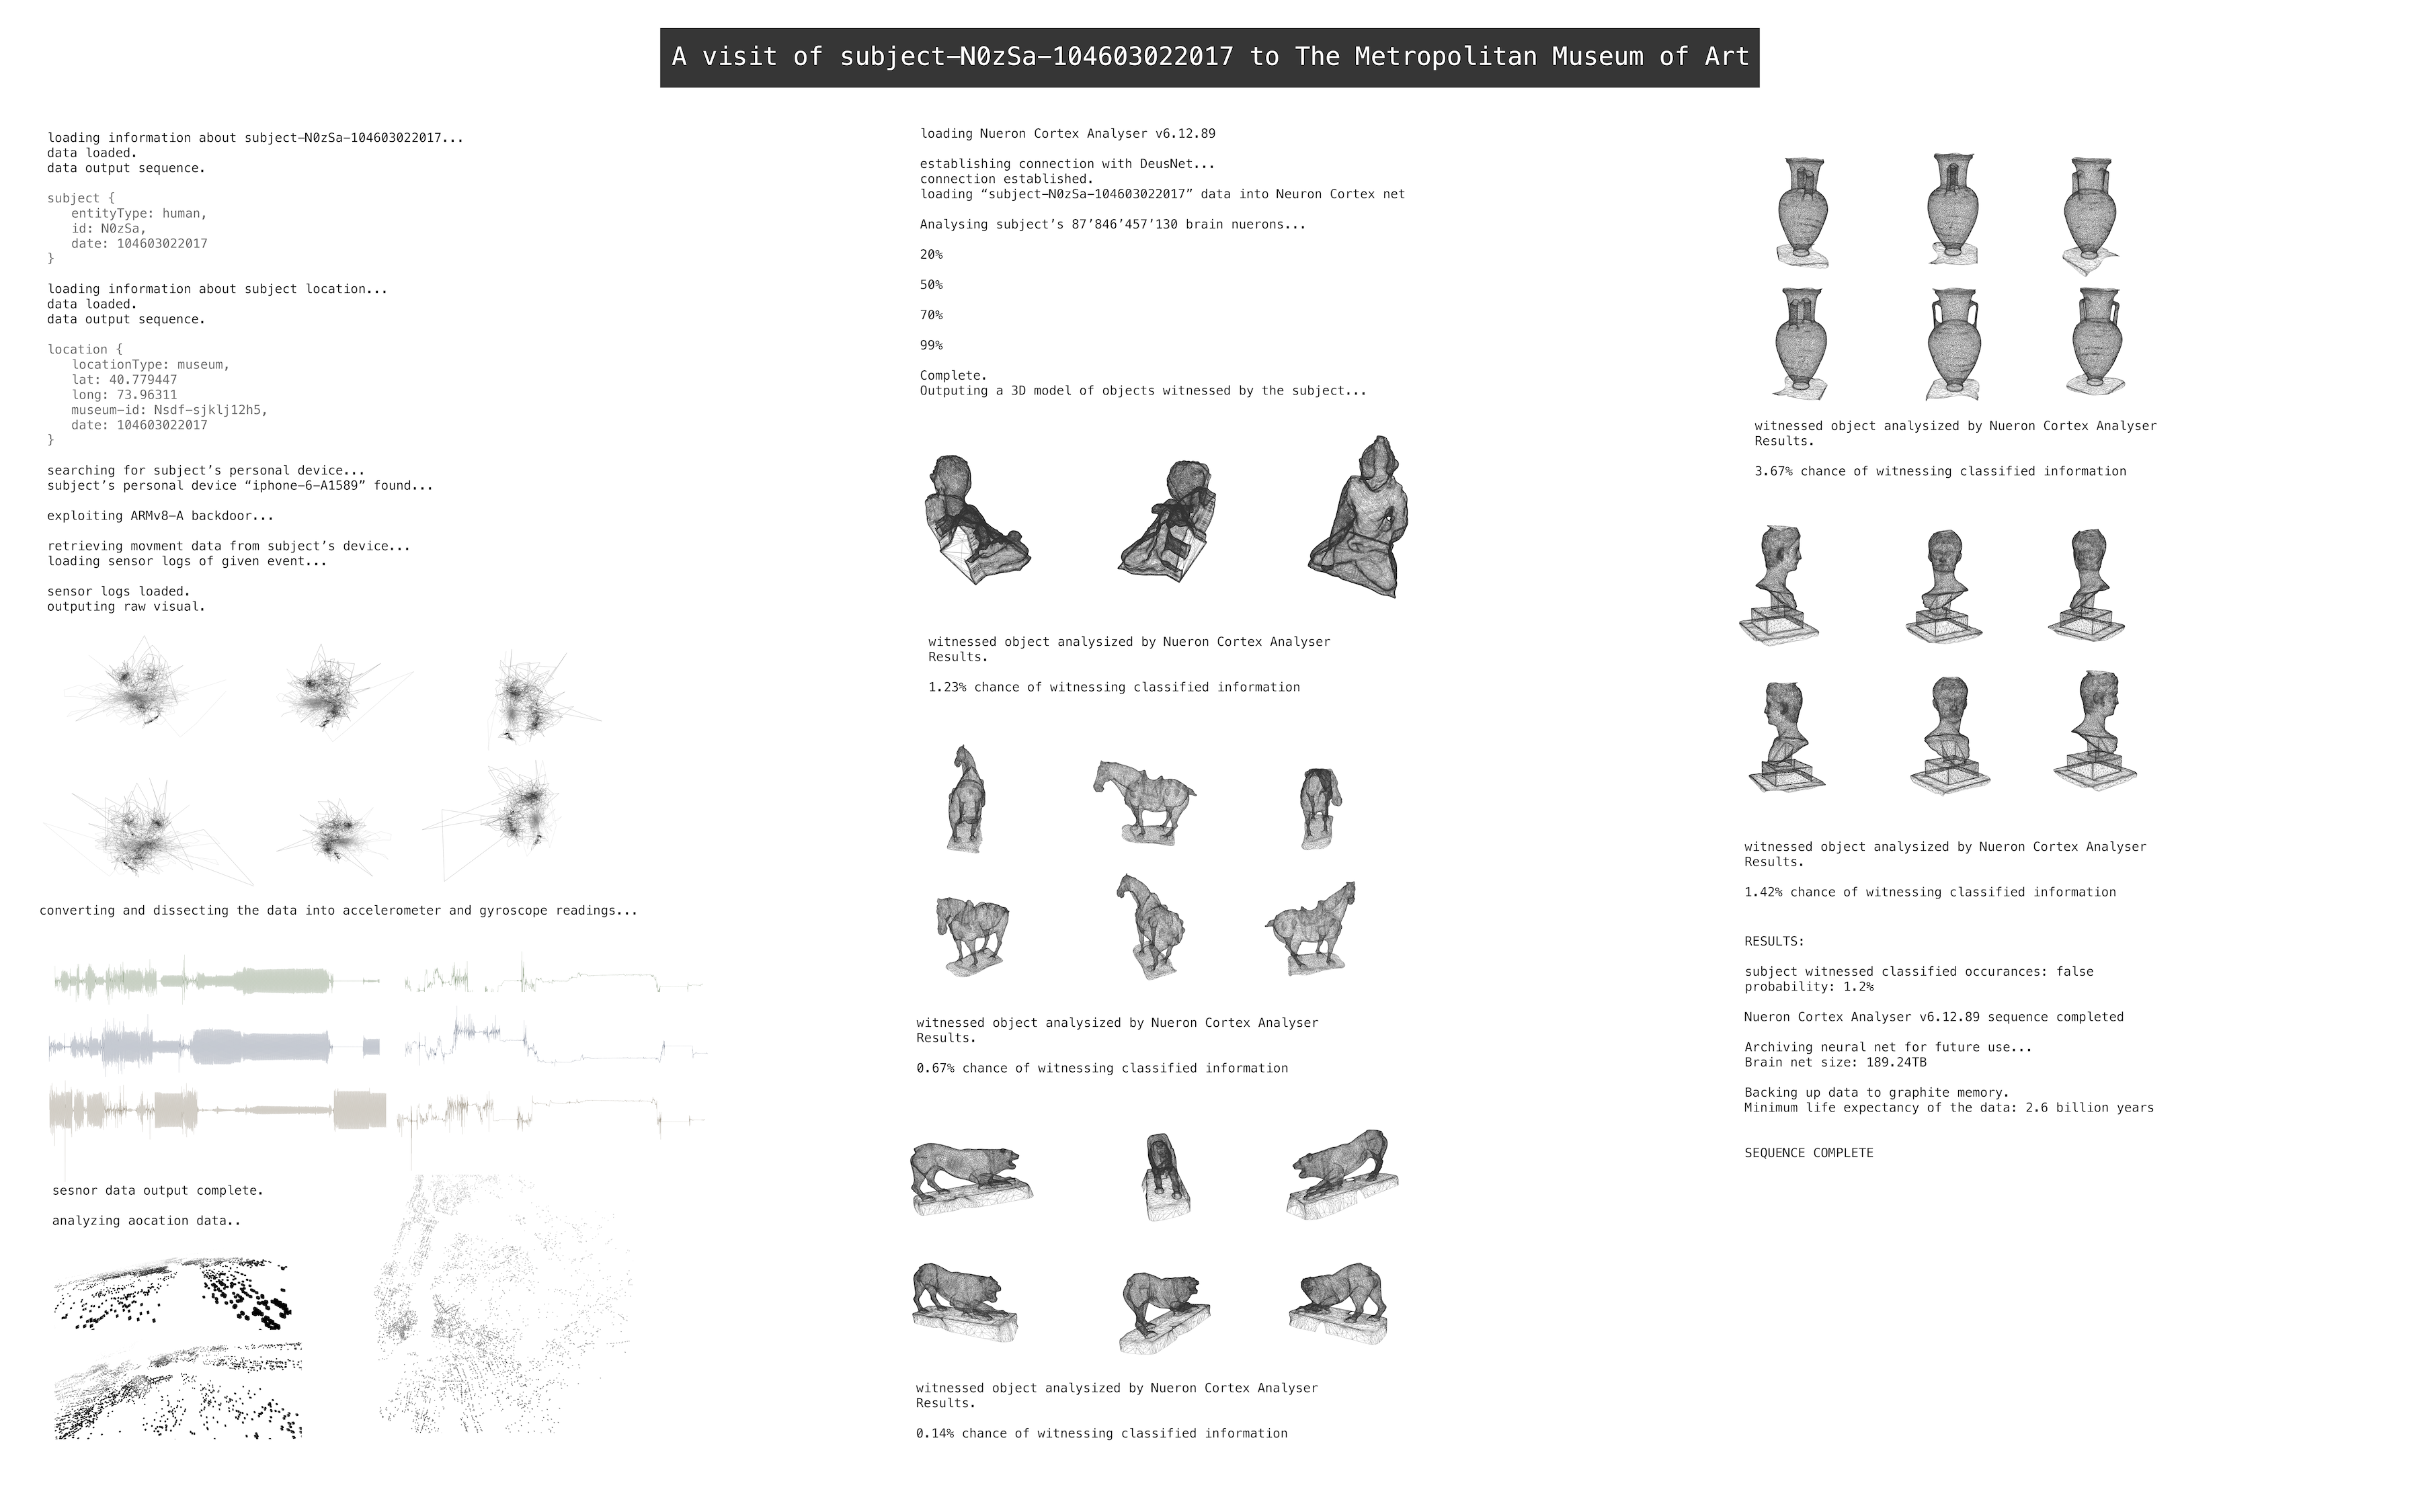
This is a speculative narrative that I decided to combine with the visualization. I imagined a world where people are treated as data subjects or entities who’s actions and subjective experiences can be quantified and determined. This can potentially undermine the very notion of art, as technologic advancements in brain-computer interfaces seem to be the perfect mean towards such an end.
Notes
Click on the titles to run in browser.